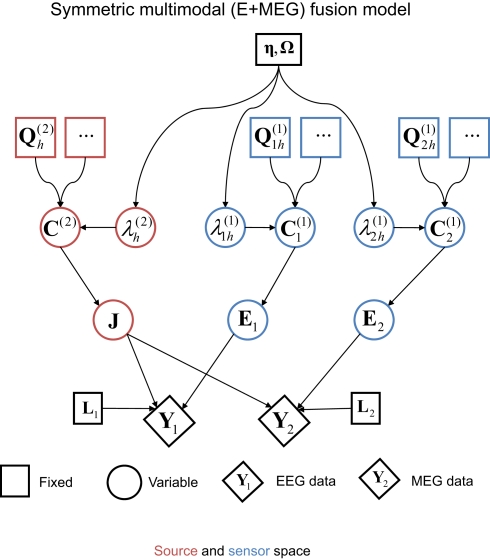
Figure 4.
The extension of the generative model in Figure 1 to the fusion of EEG and MEG data, i. e., j = 1–2 modalities (Y1 and Y2). This model was the one used to produce the results in Figure 5; i.e., with one minimum norm source prior (, where Ip is a p × p identity matrix for the p sources) and one white-noise sensor component for each modality (, where nj is the number of sensors for the j-th sensor-type).

