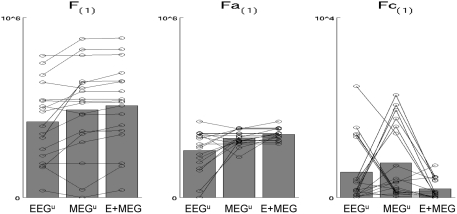
Figure 5.
The bars in the leftmost plot show the mean across subjects of the maximized free-energy (F) bound on the model log-evidence (arbitrary units) for (1) “unimodal” EEG model (EEGu), (2) “unimodal” MEG model (MEGu), and (3) bimodal “fusion” model (E + MEG). All models explain the same concatenated EEG and MEG data (projected to the time–frequency window identified in Figure 3), but “unimodal” models have a sensor-level hyperprior with a high mean and precision for the other modality, which effectively discounts data of that modality as noise (see text). The circles joined by lines show the results for each individual subject. The middle and rightmost plots show the two parts of the free-energy: the accuracy (Fa) and the model complexity (Fc); see text for details (note that these differ by constant terms that not included here). The advantage of EEG and MEG fusion is reflected by the increase in F and Fa, and decrease in Fc.

