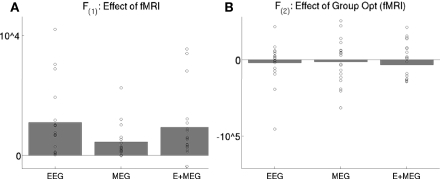
Figure 8.
The bars show the difference in the mean across subjects of the maximized free-energy bound on the model log-evidence (arbitrary units) for two models: with versus without the three fMRI priors (A), or with versus without group-optimization of those priors (B), for EEG data alone, MEG data alone, or the combined EEG and MEG data. The circles show values for each subject's difference. fMRI priors significantly improve the mean free-energy, but their group-optimization does not (as expected, see text). F(1) refers to the maximal free-energy from the first stage of group-optimization of the fMRI source hyperparameters, whereas the F(2) refers to the maximal free-energy from the second stage of individual inversion of each subject when using the group-optimized source prior (see Figure 2).

