Figure 2.

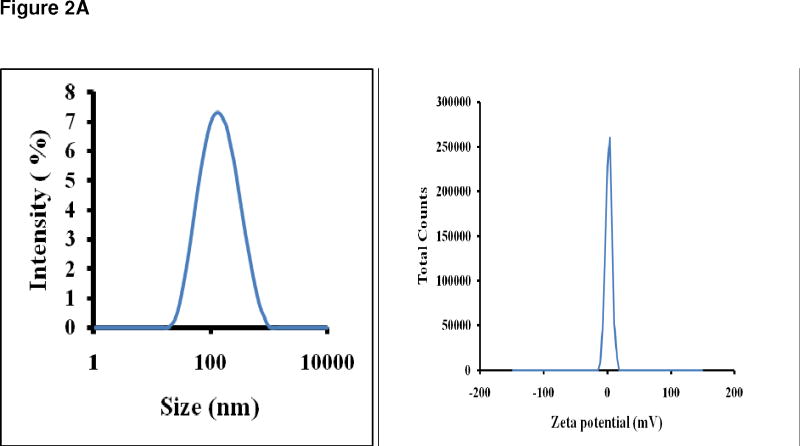
Figure 2A Left panel is the Zetasizer plot of a QD liposome suspension and reveals an average QD liposome size of 109 nm and a symmetrical size distribution. This data confirms that the nanoparticles containing QDs are of the desired size, which indicates that the encapsulation of the relatively large QDs did occur. The right panel is the plot of charge distribution indicating that the liposomal nanoparticles containing QDs were neutral, indicating that encapsulation of the QDs was complete. The lack of charge allows for a much longer in vivo circulation time.
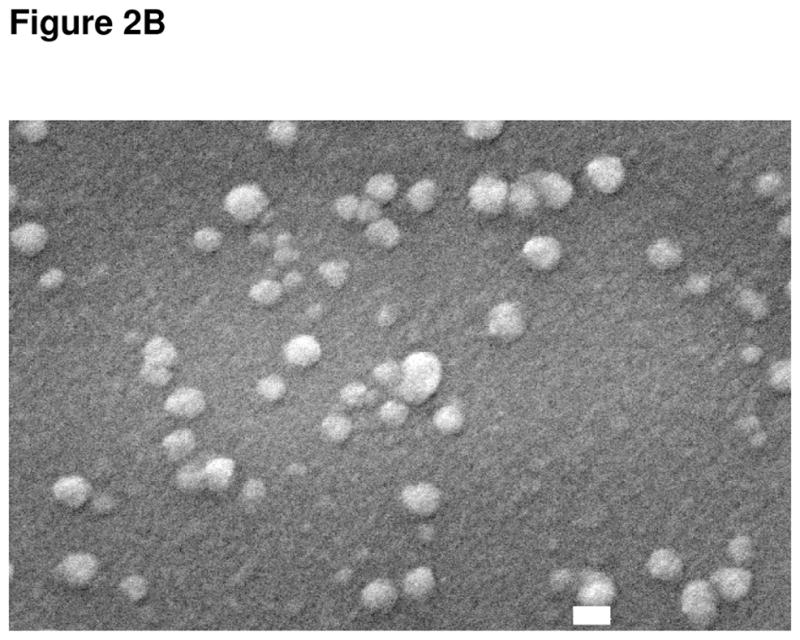
Figure 2B Electron microscope image of liposomal nanoparticles containing QDs. The spherical shape of the nanoparticles is clearly visible and they are the correct size, approximately 100 nm, as indicated by the white bar which denotes 100 nm.

