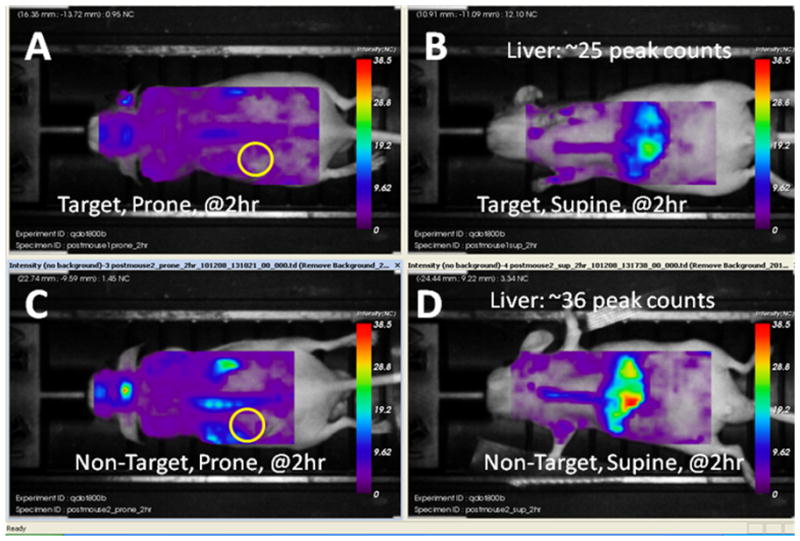
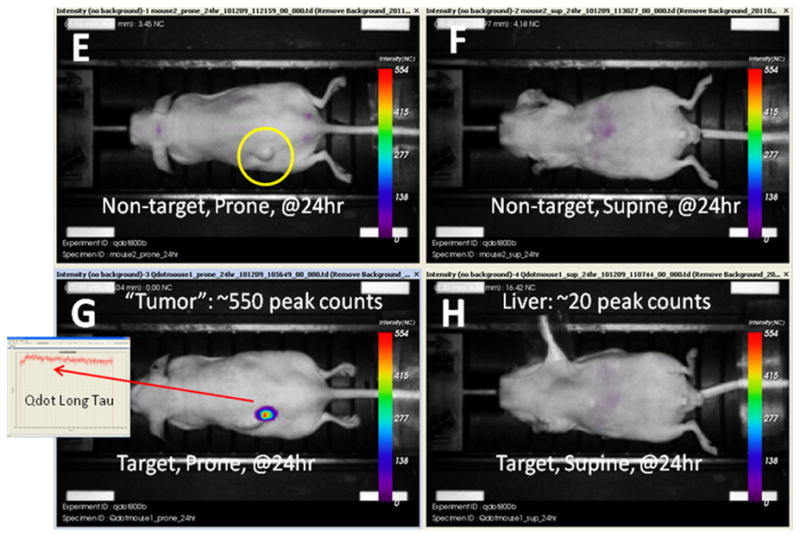
Figure 4.


Panels A–D above and E–H below. Series of brightfield grayscale images fused with fluorescence intensity images. Panels A through D were obtained at 2 hours after the intravenous injection of either targeted or non-targeted QD liposomes. The tumor site is indicated by a yellow circle on the prone images. Note that there is considerable liver uptake of both targeted and non-targeted QD liposomes resulting in strong liver labeling. At 24 hours after injection, denoted by panels E though H the QD liposomes, or at least the QDs have cleared the body either from renal clearance or via the feces. However, in 4G the targeted QD liposomes have bound to the tumor and/or its blood vessels to generate robust, clearly defined labeling. The identity of this fluorescence is confirmed to be the nanoparticle by the characteristic long fluorescence lifetime. The tumor site in the mouse that received non-targeted liposomes is shown by the yellow circle in 4E. In 4F and 4H the decline in liver labeling is quite substantial. The images were not processed and are original.
