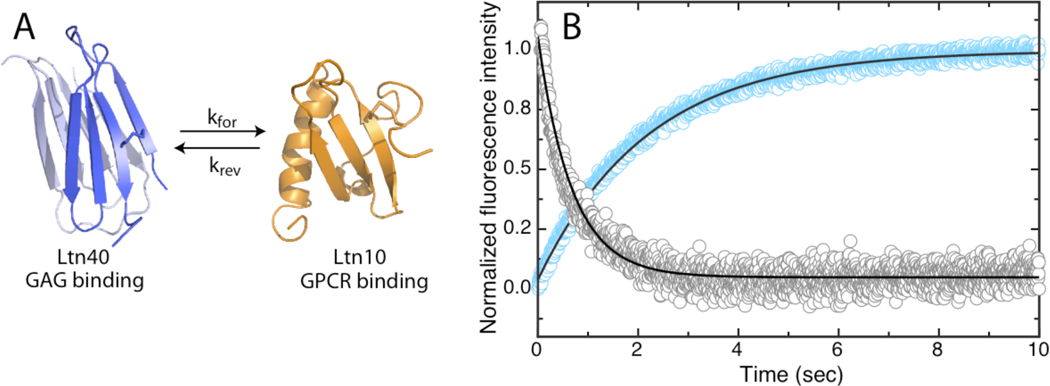
Figure 1.
A) Native state structures of Ltn depicting kinetic rate (kforward or kreverse) associated with interconversion. B) Stopped-flow fluorescence detection of Ltn interconversion. Representative kinetic traces of Ltn40→Ltn10 and Ltn10→Ltn40 conversion induced by addition of 200mM NaCl (blue) and 60uM low molecular weight heparin (gray), respectively, are shown with best-fit single exponential curves (black).

