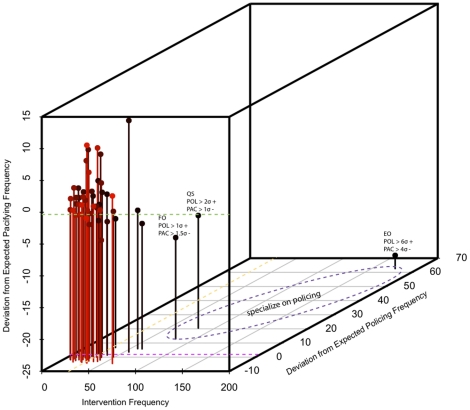
Figure 2. Specialization on policing produces a proto-division of labor in a macaque society.
Only three individuals, EO, QS, and FO, enclosed by the dashed purple ellipse, perform policing at a minimum of one standard deviation greater than the mean deviation from expected frequencies for the population (DEF; see text for definition) and pacifying at one standard deviation less than the mean DEF. EO's policing frequency is six standard deviations greater than the mean DEF. The dashed green line indicates the mean deviation from expected pacifying frequency ( = 48). The dashed fuscia line indicates the mean deviation from expected policing frequency (
 = 48). The dashed yellow line indicates the mean frequency of intervention performed by the 48 socially-mature individuals. The bar color is graded from red to black to make individual differences easier to see. The patchy distribution of the state space supports the interpretation of behavior in terms of statistically-defined strategy classes.

