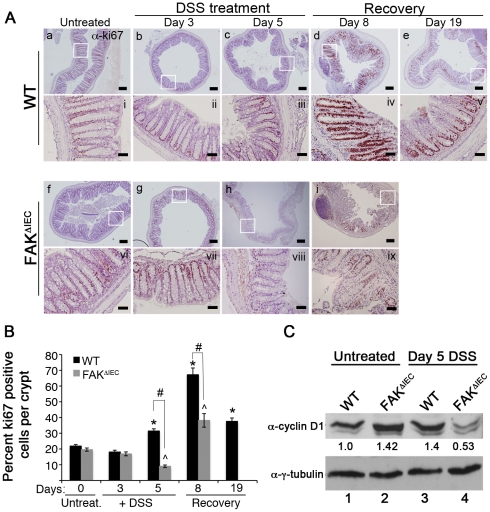
Figure 4. FAK controls proliferation in response to DSS treatment.
(A) Colon sections from untreated and DSS-treated WT and FAKΔIEC mice were immunostained for ki67 at the indicated time points. Bars represent 200 µm in low magnification (4×; panels a–i) and 50 µm in higher magnification (20×; panels i–ix) images. (B) Percent ki67 positive cells per colonic crypt in WT and FAKΔIEC mice. Data shown are the means from 2 mice for each genotype and 40 total crypts at day 0, and 3 mice of each genotype and approximately 35–60 crypts for all other time points. Asterisks denote values that are significantly different from the mean for WT mice at day 0. ∧ indicates values that are significantly different from the mean for FAKΔIEC mice at day 0. # indicates values that are significantly different from the mean for WT mice at each time point. P<0.05. (D) Immunoblot analysis of the designated proteins expressed in primary colon epithelial cells isolated from untreated (lanes 1 and 2) or Day 5 DSS-treated (lanes 3 and 4) WT and FAKΔIEC mice. Total cyclin D1 levels were quantified by densitometry, normalized to the amount of tubulin present in each sample, and expressed relative to the basal level in untreated WT mice (see numbers beneath the immunoblot). Immunoblots are representative of 2 independent experiments containing pooled lysates from 3 animals per genotype and time point.

