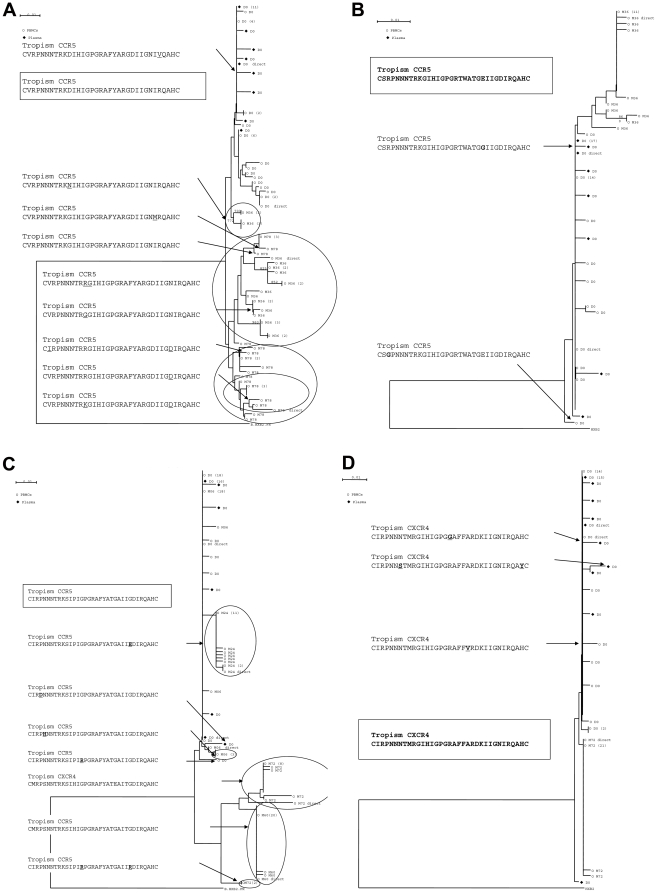
Figure 2. Longitudinal phylogenetic analysis, based on the neighbour-joining method, of clones of HIV-1 envelope gene from patient A (2A), B (2B), C (2C) and E (2D).
Clones obtained from plasma HIV-1 RNA are in full squares and clones obtained from PBMC-HIV-1 DNA are in white circles. The most frequent amino-acid sequence of the V3-loop is indicated for each patient in a square. Amino-acid substitutions within the V3-loop are underlined and correspondent variants are indicated by an arrow for each patient. Only bootstrap values ≥700 are shown. The reference sequence HXB2 was used as an outgroup. Genetic distance is indicated at the top of the figure, and represents the number of nucleotide substitutions per site. The numbers between brackets indicate the number of strictly identical sequences that segregate on the same branch.

