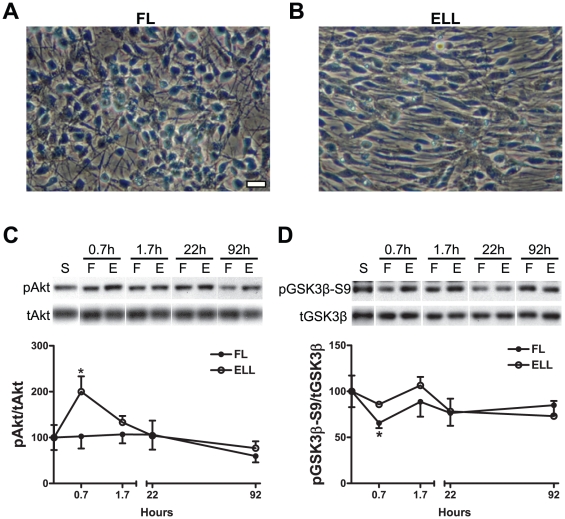
Figure 1. FGF or EGF priming exhibits different temporal patterns of signal activation in hNSCs.
(A–B) Representative phase contrast microscope images show hNSCs primed in either FL (A) or ELL (B) for 4 days. Scale bar = 25 µm. (C–D) Temporal patterns of signal phosphorylations in FL-primed vs. ELL -primed hNSCs at different time points assessed by Western blot analyses. Densitometric values, depicted as a ratio of the phosphorylated form over total amount of the specific protein, are plotted for phospho-Akt Ser473 (C) and phospho-GSK3β (Ser 9) (D). Data are presented as mean ± SEM (n = 3); * p<0.05, two-way ANOVA.

