
Figure 2.
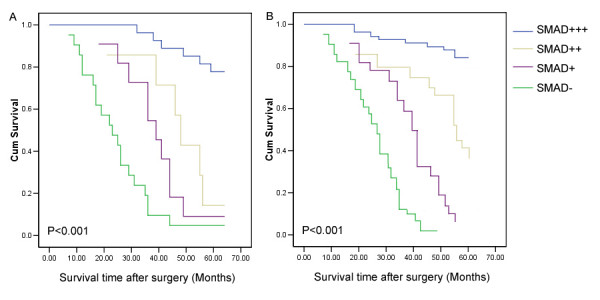
Postoperative survival curves for patterns of patients with glioma and SMAD4 expression. (A) Kaplan-Meier postoperative survival curve for patterns of patients with glioma and SMAD4 expression. Unadjusted RR of SMAD4-negative (-), weak positive (+), moderate positive (++) and strong positive (+++) groups were 1.0, 0.4, 0.08 and 0.02, respectively (P < 0.001). (B) Cox proportional hazards model after adjusting for age, gender and grade. SMAD4 might be an independent predictor of survival, without consideration of age, gender or grade. Adjusted RR of SMAD4-negative (-), weak positive (+), moderate positive (++) and strong positive (+++) groups were 1.0, 0.4, 0.2 and 0.04, respectively (P < 0.001).