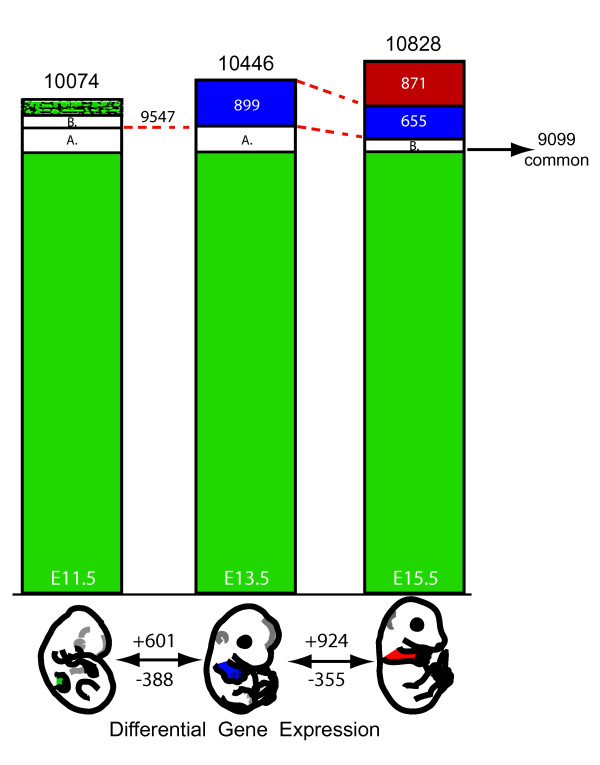
Figure 2.
Gene expression dynamics during three stages of limb development. Top: The expressed UCSC Known Genes at the three limb developmental stages. Smooth green areas represent genes expressed at all three stages (n = 9099). Blue areas show genes whose transcription is gained at E13.5 (n = 899) and still found expressed in embryos at E15.5 (n = 655). The red area represents genes that are significantly expressed only at E15.5 (n = 871). The patterned green area in E11.5 highlights those genes that are expressed only at E11.5 (n = 297). The white areas indicate genes that are expressed in both E11.5 and E13.5 limbs, but not at E15.5 (A; n = 475), or with genes expressed in both E11.5 and E15.5 (B; n = 203), yet not in E13.5 limbs. Bottom: Differential gene expression in forelimbs between the developmental stages. The numbers of up- and down-regulated genes are indicated above and below the arrows, respectively.

