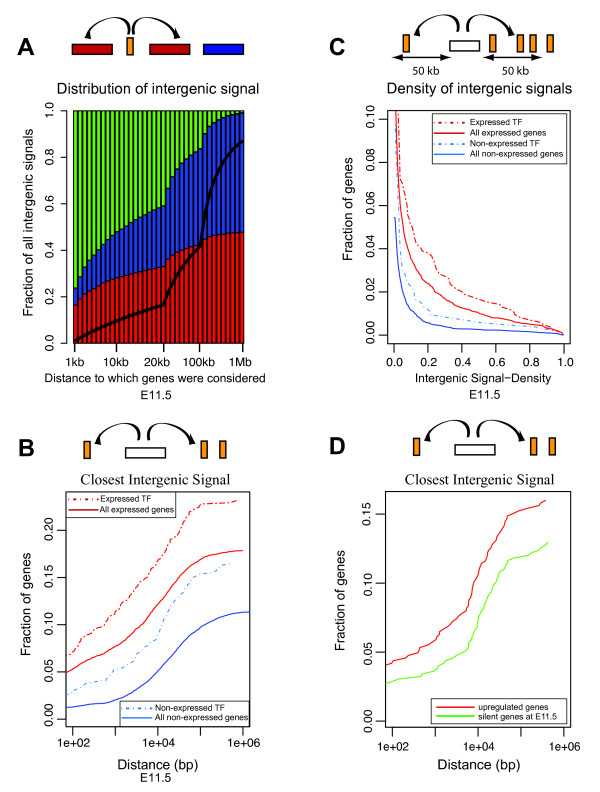
Figure 3.
Intergenic transcription and proximity to expressed genes. A: All 4312 expressed intergenic regions (orange) at E11.5 were annotated as 'close to' an expressed gene (red), 'close to' a non-expressed (blue), 'not close to' a gene (green). Black lines show the expected borders between blue and green areas if genes were distributed randomly relative to expressed intergenic regions. B: Expressed genes are enriched with nearby intergenic transcription. Fraction of genes (expressed, solid red line N = 8582; or not-expressed, solid blue line N = 14848) with an expressed intergenic region within x bp is plotted over genomic distance (x-axis, log scale). Transcription factors (TF) selected based on Gene Ontology terms (GO:0003700; GO:0006355) (expressed, dashed red line N = 847; not expressed, dashed blue line N = 534) showed higher fractions in both categories when compared to all genes. C: A gene neighborhood was defined as its upstream and downstream regions half-way to the next annotated gene or maximally 50 Kb. The fraction of genes (expressed, red; not-expressed, blue), which contain unexplained intergenic signals within neighborhood is shown. Expressed genes have more of their neighborhoods covered by intergenic signals (top red and blue line). D: Transcription of intergenic sequences increases as nearby gene expression increases. For a selection of genes (N = 525) up-regulated from below threshold at E11.5, to above threshold at E13.5 or E15.5, the fraction with nearby intergenic signals is shown as in B at E11.5 (green) and E15.5 (red). A higher fraction of genes with nearby intergenic transcription is seen at E15.5, as the expression increases.

