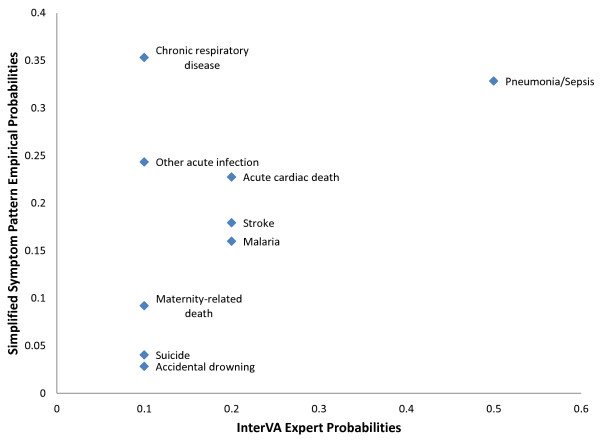
Figure 6.
Comparison of Simplified Symptom Pattern empirical probabilities and InterVA expert probabilities. The scatter plot compares the probabilities of InterVA versus SSP for selected causes, given the symptom acute cough. This difference of posterior probabilities is partially responsible for the superior performance of SSP.

