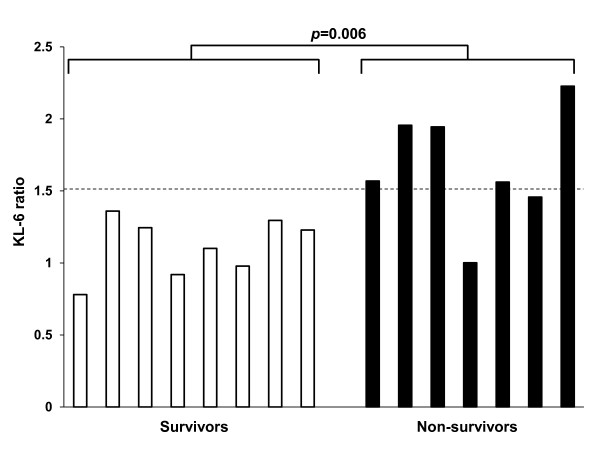
Figure 4.
The ratios of the serum levels of KL-6 at the onset of EGFR-TKIs induced ILD to those at baseline in 8 survivors and 7 non-survivors. Open and solid bars represent survivors and non-survivors, respectively. There is a significant difference in these ratios between the survivors and non-survivors (p = 0.006).

