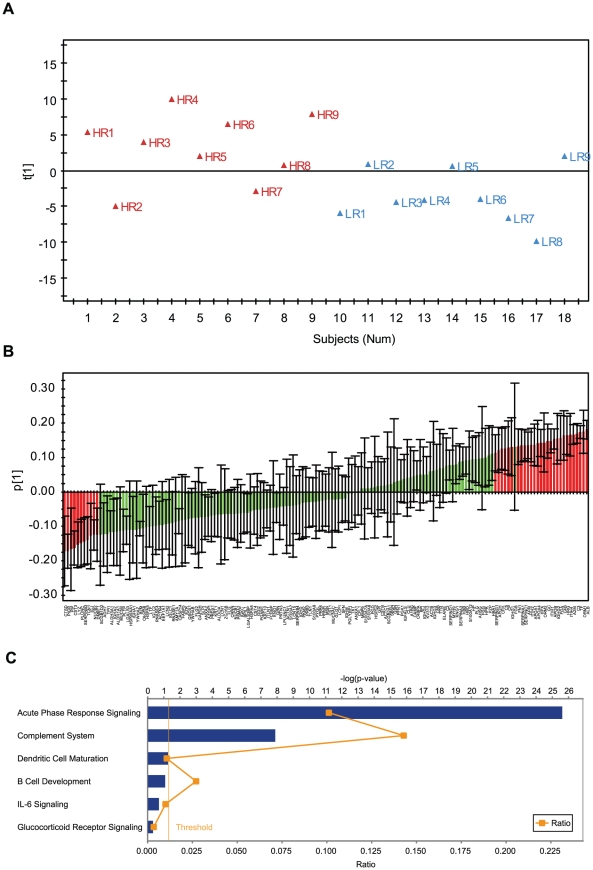
Figure 2. Differences in nasal fluid protein profiles between symptomatic HR and LR.
OPLS-DA modelling was performed with 161 nasal fluid proteins identified in no less than 50% HR and LR. A) OPLS-DA score plot showed partial separation between HR and LR, where t[1] represents the predictive component. All samples were within a ±2 standard deviation (SD) limit (according to Hotelling's T2). B) OPLS-DA loading plot with confidence intervals (according to the cross validation procedure). The top 40 proteins that contributed to separation between HR and LR were highlighted in red. The black line represents error bar. C) Pathway analysis with the top 40 proteins using the IPA software. The yellow threshold indicates 95% confidence.

