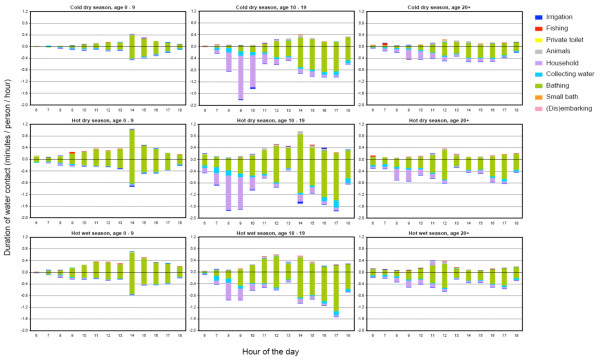
Figure 3.
Duration of water contact. Duration of water contact by season, hour of the day, age, sex (boys up = positive values; girls down = negative values), and type of activity (see legend) for 1,651 inhabitants of the rural village of Ndombo in Northern Senegal as recorded during 175 days of observational studies. This graph reflects the division of the total durations (i.e. 1,257,985 min) given in Table 2. Hour of the day is the first moment of each one-hour interval.

