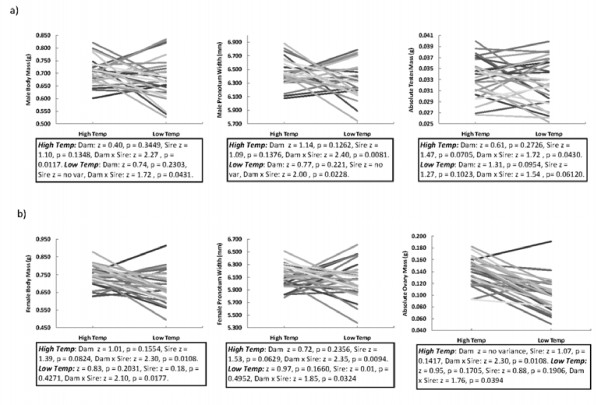
Figure 2.
Interaction plots, showing the mean trait values and reaction norms for each Dam × Sire line combination across each thermal environment (27° vs 23°C) for each trait type in a) males and b) females. Thus, each line represents a distinct Dam × Sire genotype. Below each plot, we present the statistics for each environment separately (i.e. Dam and Sire effects within each thermal treatment).

