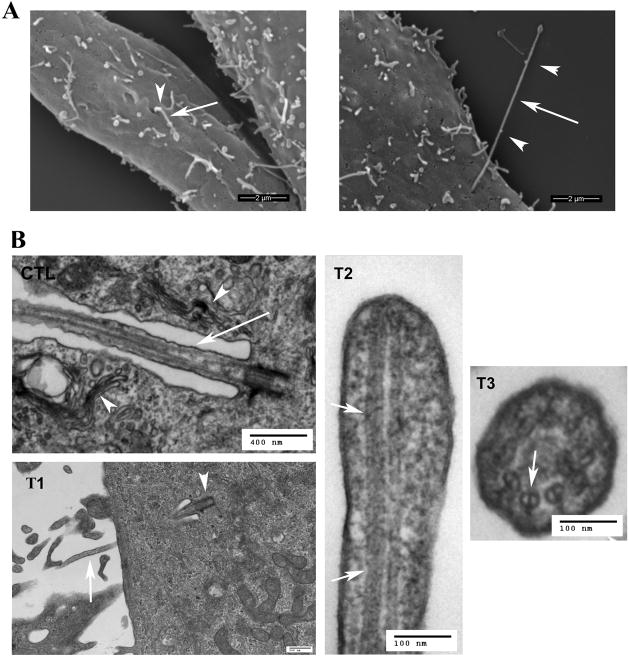
Figure 3. Ultrastructural analysis of primary cilia.
A. Scanning electron microscopy. Left image, untreated FLS cells; Right image, lithium-treated FLS cells. FLS cells were treated with 100 mM lithium chloride for 12 hrs. Shown are the extracellular portion of the primary cilia (arrows) and potential IFT particles (arrowheads). Bar = 2 μm. B. Transmission electron microscopy. CTL, untreated control sample. The arrow points to the portion of a primary cilium that lies in an invagination of the plasma membrane. Note that the invagination is lined with Golgi complexes (arrowheads). T1–T3, serum-starved FLS cells treated with 100 mM lithium chloride for 12 hrs. T1, an elongated primary cilium extending from the basal body (arrowhead) into the invagination of the plasma membrane and protruding outside the cell (arrow). T2, longitudinal section of the tip of a primary cilium. T3, cross-section of an elongated primary cilium inside the invagination of the plasma membrane. Note that both longitudinal (T2, arrows) and cross-sections (T3, arrow) reveal double microtubules, and that these doublets extend to the tip of the cilium (T2). Bars in different images represent different length. CTL, bar = 400 nm; T1, bar = 500 nm; T2, bar = 100 nm. T2, bar = 100 nm.

