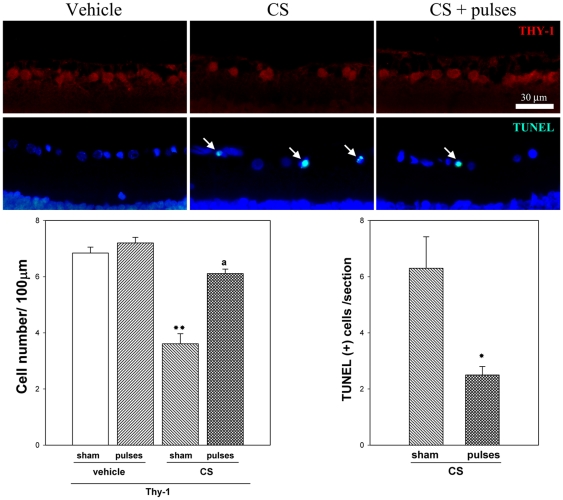
Figure 4. Thy-1 level and TUNEL assessment after 10 weeks of ocular hypertension.
Representative photomicrographs showing Thy-1 immunofluorescence (upper panel) and TUNEL analysis (middle panel) from a vehicle-injected eye, and a hypertensive eye without or with pulses of ischemia. Note TUNEL+ cells in the GCL (arrows). Cell nuclei were counterstained with DAPI. Lower panel: The number of Thy-1 positive cells was significantly lower in hypertensive eyes without ischemia pulses than in vehicle- injected eyes, whereas the application of ischemia pulses in CS-injected eyes increased Thy-1 immunostaining. The number of TUNEL+ cells in the GCL was significantly higher in hypertensive eyes submitted to a sham procedure than in those submitted to ischemia pulses. No TUNEL+ cells were observed in vehicle-injected eyes submitted to ischemia pulses or sham procedure (not shown). Scale bar: 30 µm. Data are mean ± SEM (n = 5 eyes per group). For TUNEL analysis: * p<0.05 versus CS-injected eyes submitted to sham procedure, by Students t-test; For Thy-1 analysis: **p<0.01 versus vehicle injected eyes without ischemia pulses (sham), a: p<0.01, versus CS-injected eyes without ischemia pulses (sham), by Tukey's test.

