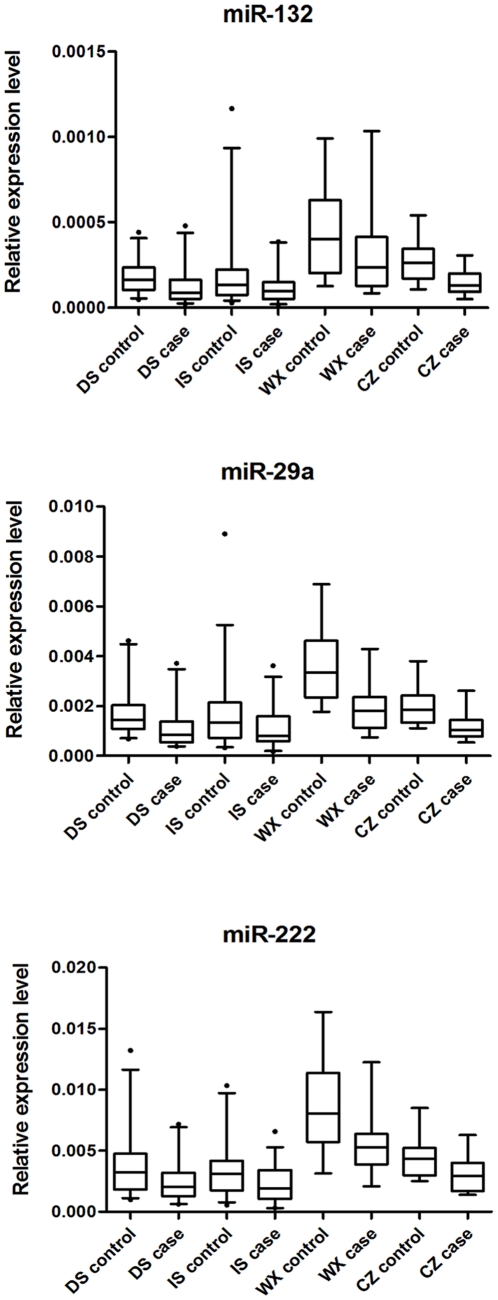
Figure 1. Expression levels of miRNAs.
DS: discovery stage; IS: internal validation stage; WX: Wuxi; CZ: Changzhou Three serum miRNAs were quantified by qRT-PCR in patients with subsequent GDM and matched controls (n = 24, 36, 16 and 16 each for DS, IS, WX and CZ, respectively). The Box-whisker Plot represented the relative expression levels of miRNAs that were determined by the equation 2−ΔCT, in which ΔCT = CT sample-CT cel-39. The bottom and top of the box were the 5th and 95th percentiles, and the band near the middle of the box was the 50th percentile of the relative expression levels of miRNAs. Any data beyond these whiskers were shown as points.

