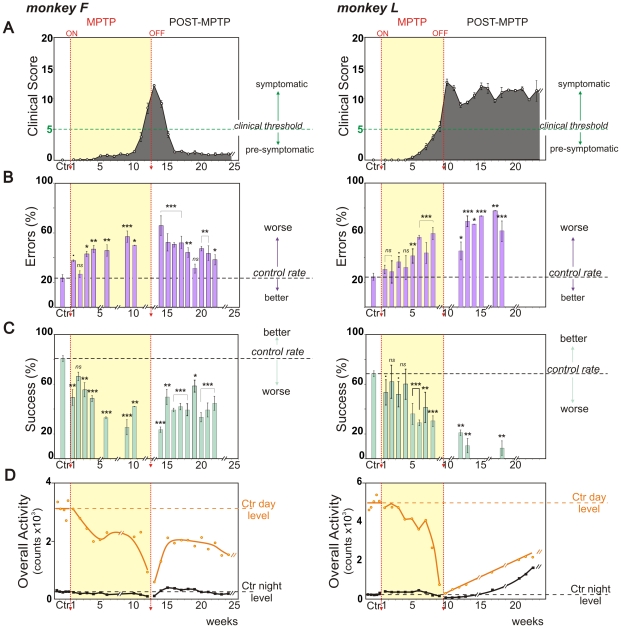
Figure 3. Changes of behavioral parameters over MPTP and Recovery periods.
Weekly behavioral measures (mean ± SEM) for monkey F, left and monkey L, right. A. Clinical score variations from PMRS. B. Percentage of errors (barrier hits, purple) and C. Percentage of successes (direct reach, blue) at the detour task. D. Total daytime (orange circles) and night time (black squares) locomotor activity counts and associated curves of activity smoothed with the rloess method (span = 0.5). Conventions as for Figure 2.

