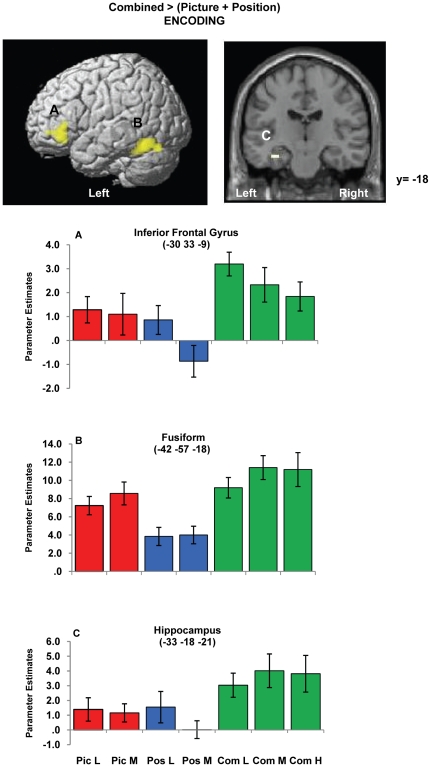
Figure 3. Combined task-related activity during encoding.
L = Low load, M = Medium load, H = High load, Pic = Picture task, Pos = Position task, Com = Combined task. Left top image shows group mean activity for the contrast ‘Combined >(Picture + Position)’ for the encoding phase and is superimposed on the SPM rendered brain image. Activity depicted is significant using a cluster-defining whole brain threshold of p<0.001 and FWE (p<0.05) cluster correction. Right top image shows significant left hippocampal activity using region-of interest analysis (FWE p<0.05 corrected applied voxel-wise to bilateral hippocampal mask). Increased activity was observed for the Combined task relative to the averaged single feature tasks at equal load levels in these regions. Plots of the mean parameter estimates (β coefficients) for each task and load condition are provided for peak voxels of the identified suprathreshold clusters. Beta estimates for the High load are also included to depict relative effects between load levels in the Combined task, however the main task effects were based on Low and Medium loads. Error bars represent ±1 standard error of the mean.

