
Figure 3.
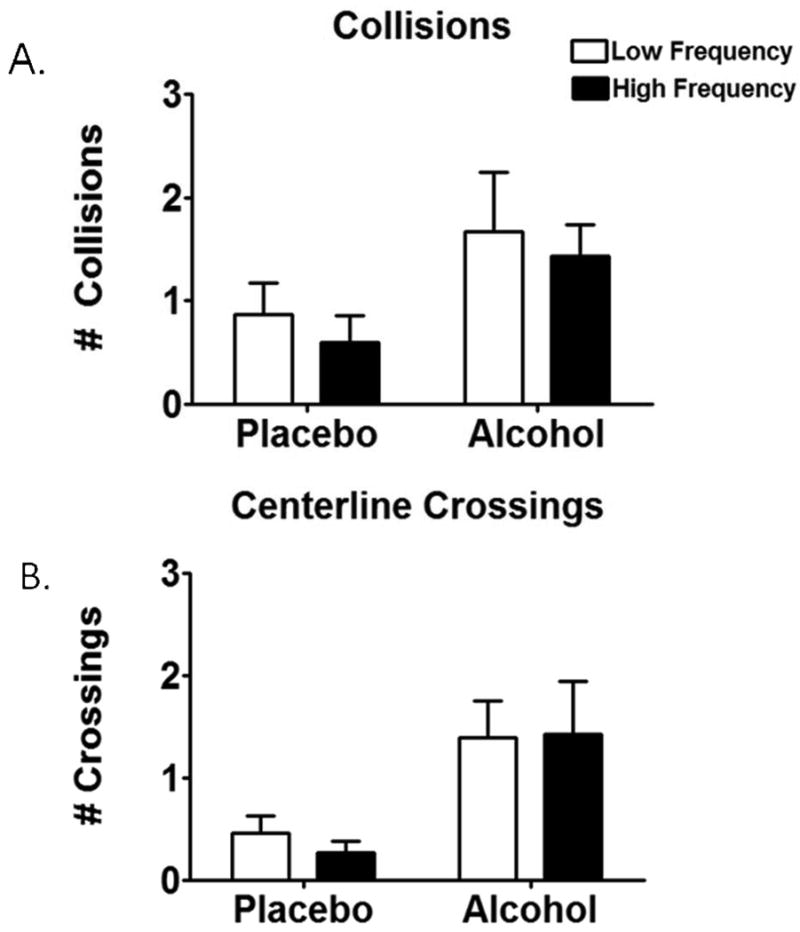
Driving errors after alcohol and placebo. Alcohol increased collisions (A) and centerline crossings (B) in both the High and Low Frequency groups (main effect of alcohol, p < 0.05).
Official websites use .gov
A
.gov website belongs to an official
government organization in the United States.
Secure .gov websites use HTTPS
A lock (
) or https:// means you've safely
connected to the .gov website. Share sensitive
information only on official, secure websites.
Driving errors after alcohol and placebo. Alcohol increased collisions (A) and centerline crossings (B) in both the High and Low Frequency groups (main effect of alcohol, p < 0.05).