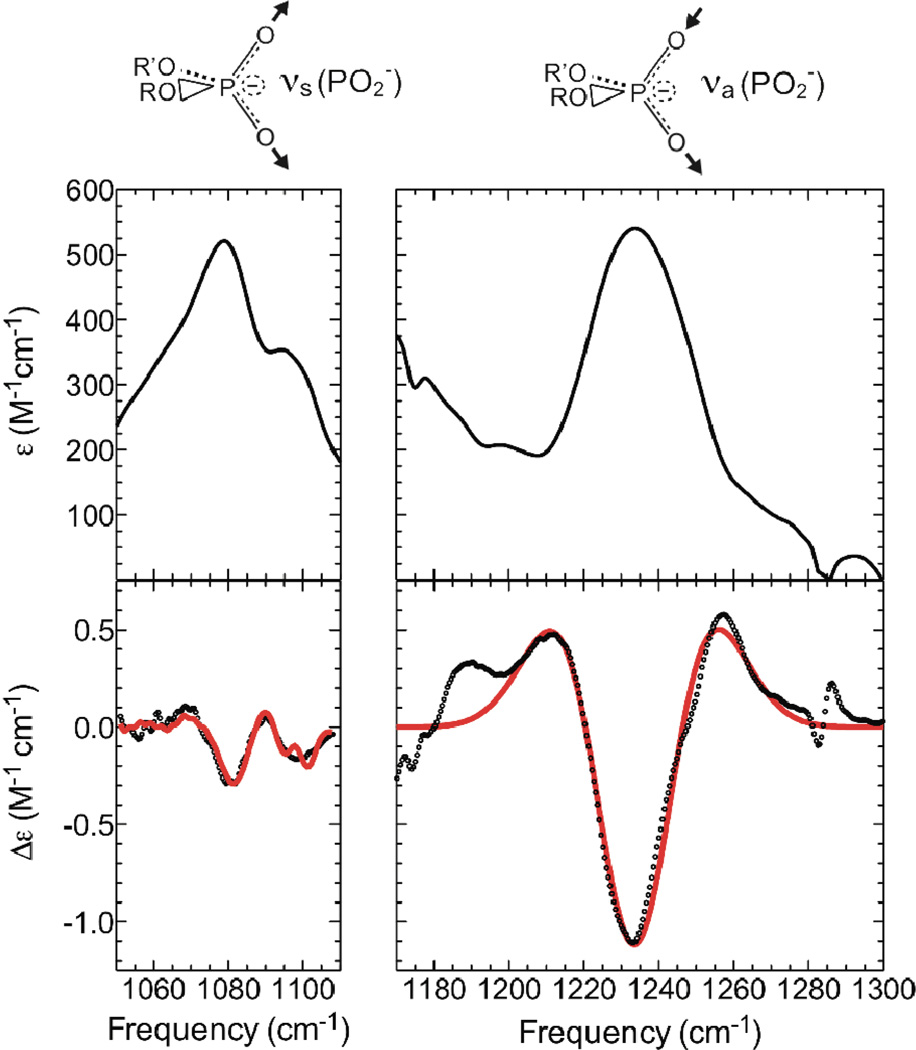
Figure 1.
Absorbance (upper) and Stark (lower) spectra of the phosphate region of phospholipid/toluene samples at 77K. The spectra of the phospholipid symmetric stretch (left) and the antisymmetric stretch (right) were scaled to M−1cm−1, and Stark spectra (bottom panels) were additionally scaled to an applied field of 1 MV/cm. Experimental Stark spectra are shown as dots, and numerical fits as solid red lines.

