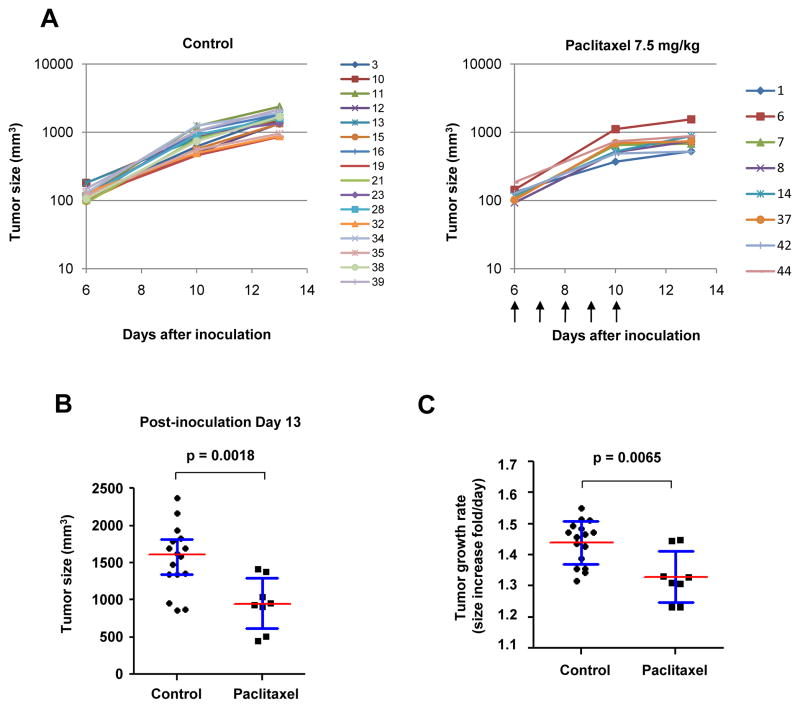
Figure 3. Efficacious paclitaxel treatment delays the growth of subcutaneous tumors.
When subcutaneous LLCom tumors reached 125 mm3, mice were randomized to receive vehicle solution (control) or 7.5 mg/kg of paclitaxel (treated). Tumor growth curves of individual mice in control or treated group are shown in (A) and (B), respectively. Marker indicating the mouse number is listed to the right of each chart. Arrows under (B), dosing schedule. (C) At day 13, tumor size in treated group is significantly smaller than that in control group. (D) Growth rate in the treated group was significantly reduced relative to the control group. The tumor sizes at various time points were converted to “fold-increased per day”. The p value in (C) and (D) was obtained by unpaired t-test.

