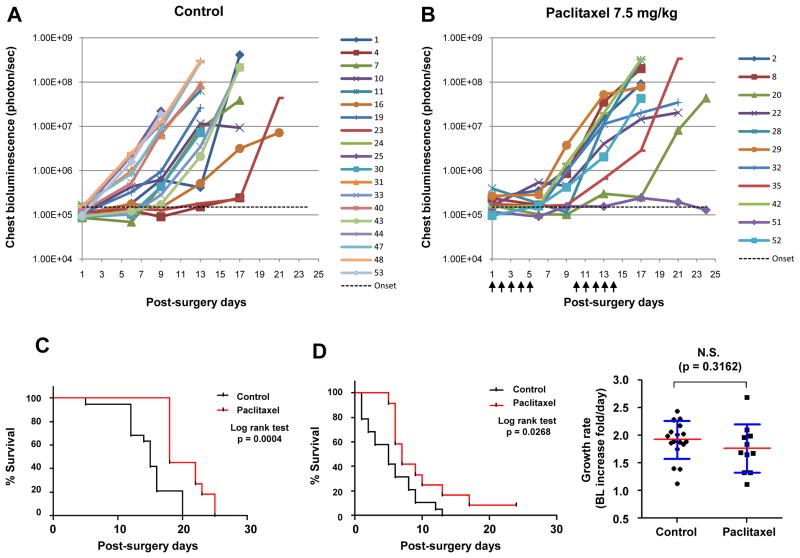
Figure 4. Efficacious paclitaxel treatment prolonged disease-free and overall survival in a spontaneous metastasis model without significant effect on disease growth rate.
After resection of the subcutaneous LLCom tumors at 500 mm3, mice were randomized to receive vehicle solution (control) or 7.5 mg/kg of paclitaxel (treated). By BL monitoring, metastatic growth curves of individual mice in control and treated group are shown in (A) and (B), respectively. Markers at the right of the chart indicate individual mouse data. Arrows under (B), dosing schedule; green dash line, macrometastatic threshold. (C) Kaplan-Meier analysis showing that post-surgery overall survival (OS) and disease-free survival (DFS) was significantly prolonged in treated groups relative to control group. (D) The treatment had no significant effect on the growth rate of pulmonary metastasis. For each mouse, time course of chest BL was converted to “fold-increased per day”. N.S., not significant. The p value was obtained by unpaired t-test.

