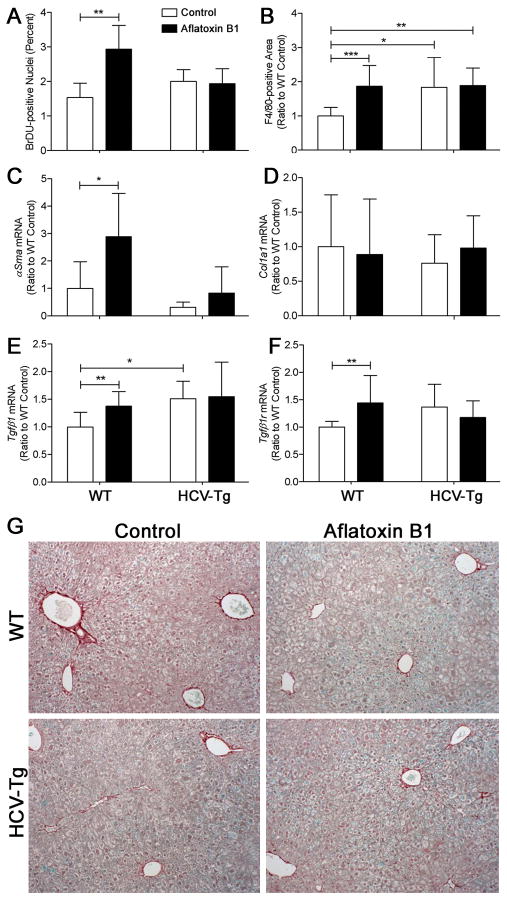
Figure 2. Hepatocyte proliferation, inflammation and fibrosis markers.
(A) Percent BrDU-positive nuclei (n=4–8/group; mean±standard deviation for 5 randomly selected fields at 200x); (B) area occupied by F4/80-stained cells (n=9–16/group; mean±standard deviation for 10 randomly selected fields at 100x) relative to WT group. Liver expression (evaluated using real-time PCR and normalized to levels in WT group; n=6–16/group) of smooth muscle actin-alpha (C), collagen 1-alpha1 (D), transforming growth factor beta1 (E) and its receptor (F). Asterisks (*, ** and ***) denote statistical significance (p<0.05, p<0.01 and p<0.001, respectively) between the groups as indicated. (G) Representative Sirius red-stained sections (100x) from 12 months old animals of WT/AFB1 and HCV-Tg/AFB1 groups.

