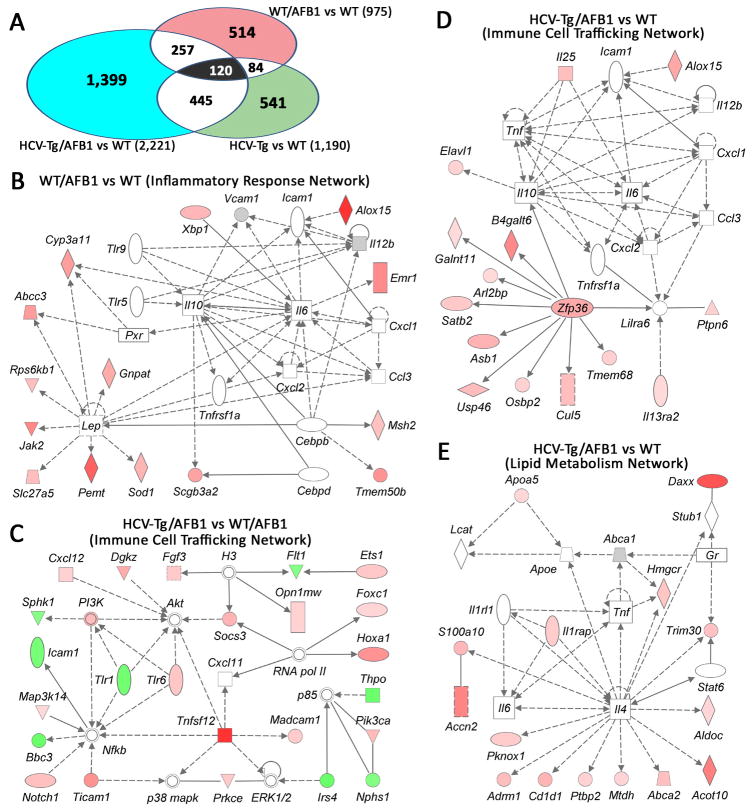
Figure 5. Microarray analysis of liver tissues from WT and HCV-Tg mice treated with AFB1.
(A) Venn diagram showing genes that were significantly different between the groups as indicated. The number of genes in each comparison is shown. (B–E) Molecular network interactions between the genes significantly different between each group (as indicated) were visualized using Ingenuity® database. Up-regulated genes are identified in red, down-regulated in green.

