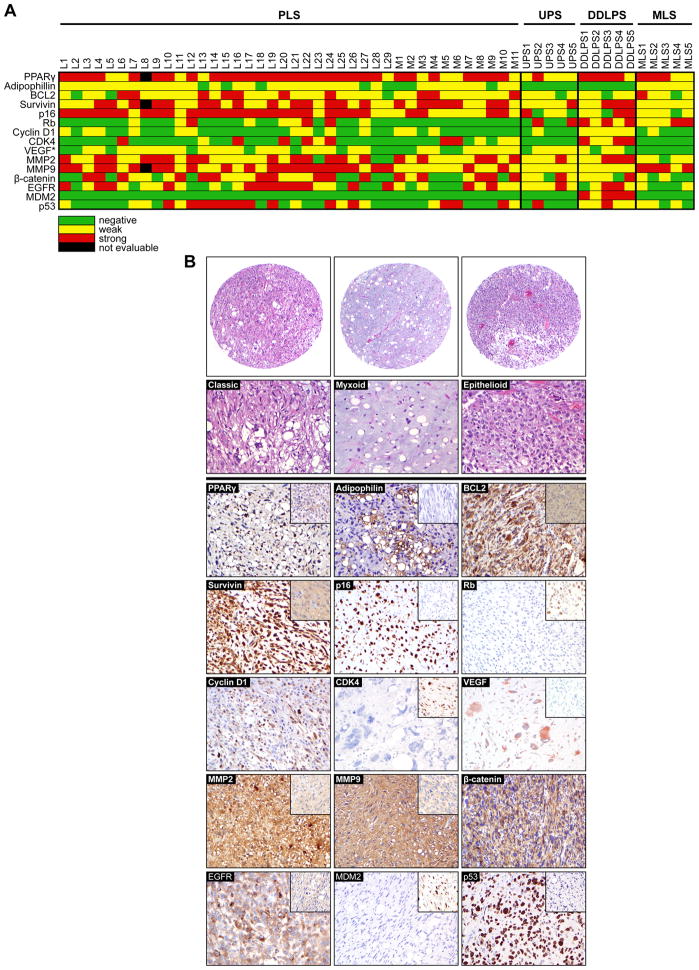
Figure 2. Protein biomarker expression in human PLS.
A. “Heatmap” summarizing expression levels of each of the proteins evaluated in all individual scorable samples (* VEGF was only scored as positive or negative); B. Immunohistochemical images demonstrating representative levels of evaluated markers in human PLS specimens (controls included as insets: PPARγ = low expressing PLS, adipophilin = DDLPS, BCL2 = low expressing PLS, survivin = low expressing UPS/MFH, p16 = low expressing PLS, Rb = high expressing PLS, CDK4 = DDLPS, VEGF = negative expression PLS, MMP2&9 = negative expressing PLSs, EGFR = low expressing PLS, MDM2 = DDLPS, p53 = low expressing PLS). All original images were captured at ×200 magnification.

