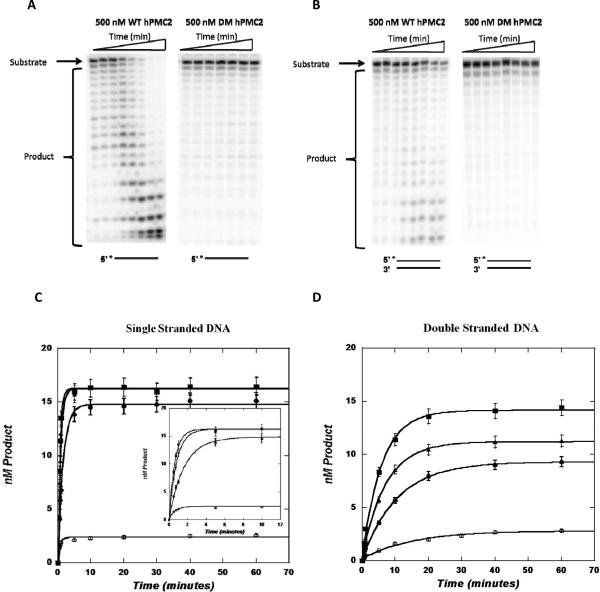
Figure 2. Representative autoradiograms and graphs of single and double stranded substrates with WT and DM hPMC2.
Single-turnover experiments, in which enzyme concentration is in excess of DNA, were performed with 20 nM single or double stranded EpRE substrate and increasing concentrations of either WT or DM hPMC2. The DNA was radioactively labeled on the 5'-end and increasing amounts of the enzyme was added and the reaction monitored for a period of one hour. Gel images were obtained with a Molecular Dynamics Storm 840 phosphorimager system and data analysis was performed using ImageQuaNT software. The increase in product formation observed over the time course of the reaction was then plotted on Kaleidagraph. A. Representative autoradiogram of three independent experiments of single stranded EpRE substrate with 500 nM WT or DM hPMC2. B. Representative autoradiogram of three independent experiments of double stranded EpRE substrate with 500 nM WT or DM hPMC2. C. Kaleidagraph of product formed over time with single stranded EpRE substrate at varying concentrations of WT or DM hPMC2: 100 (●), 300 (▲), 500 (■) nM WT hPMC2 and 500 nM (◯) DM hPMC2. The inset shows the same plot over a shorter time period (12 min.) to illustrate the difference in the rate constants at varying concentrations of the enzyme. D. Kaleidagraph of product formed over time with double stranded EpRE substrate at varying concentrations of WT or DM hPMC2: 100 (●), 300 (▲), 500 (■) nM WT hPMC2 and 500 nM (◯) DM hPMC2.

