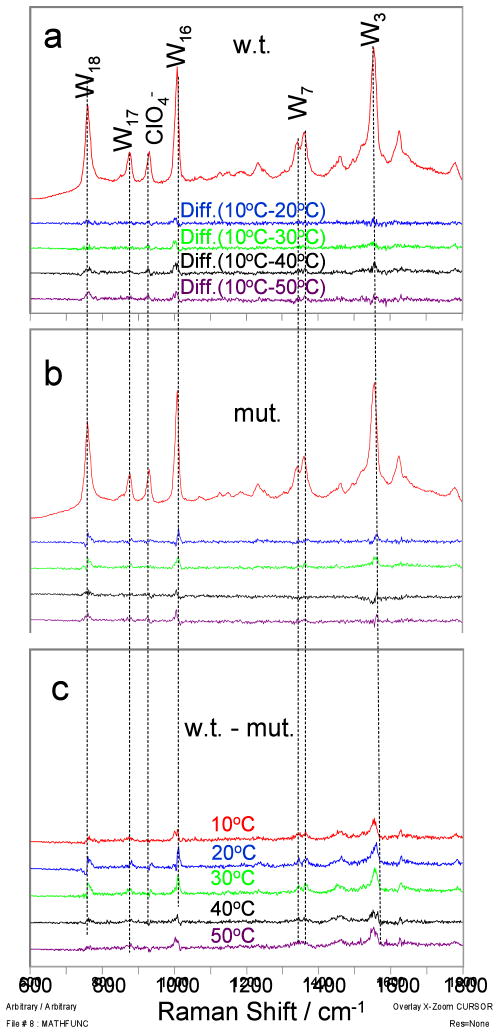
Figure 6.
229 nm excited UVRR spectra of the p53 wild-type and mutant peptides. a) 10 °C spectra of the wild-type peptide and difference spectra between the 10 °C spectrum and that at higher temperature, b) temperature difference spectra of the mutant peptide; c) difference spectra between wild-type and mutant peptide. All spectra were normalized to the peak height of the 932 cm−1 ClO4− band.

