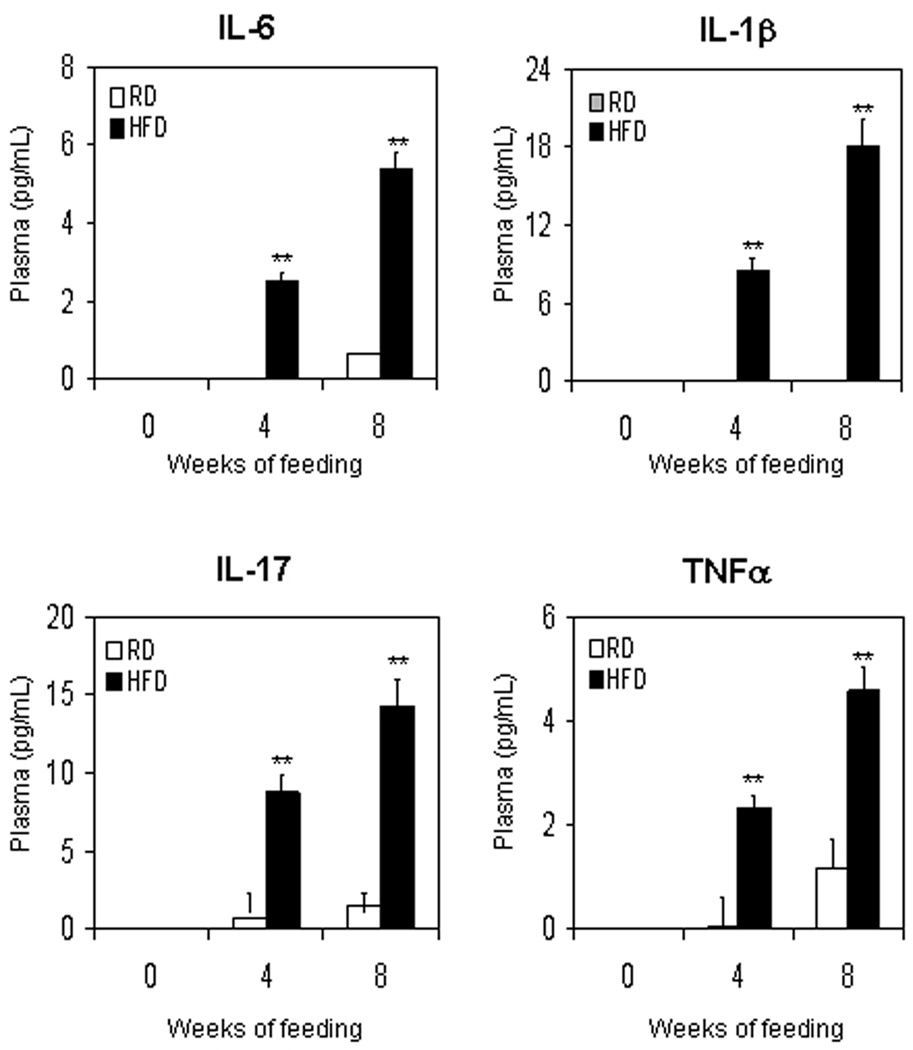
Figure 1.
Plasma cytokines levels in C57BL/6 mice after feeding with regular diet (RD) and high-fat diet (HFD). Plasma was collected from mice fed with RD or HFD for 4 and 8 weeks and were used for measuring the levels of IL-6, IL-1β, IL-17 and TNF-α by the Beadlyte™ mouse multi-cytokine detection assay. White bars indicate RD and black bars indicate HFD. Data are a mean of ± SD. **p<0.001, represents the significant changes in cytokine levels by HFD compared to its respective RD treated group.

