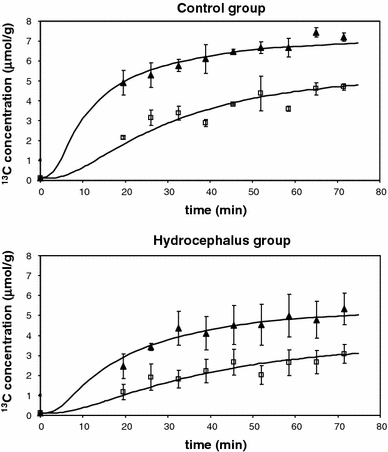
Fig. 2.

Incorporation 13C into [4-13C]glutamate (black triangles) and [3-13C]glutamate (open squares) for the control group and the hydrocephalus group (μmol/gram/min). The error bars at each experimental point denotes the SEM of three individual animals in each group. The best fits of the metabolic model to the data are shown as continuous lines and the values of the rate of the neuronal TCA cycle and the exchange rate between a-ketoglutarate and glutamatecorresponds to the best fit. These metabolic rates are given in Tabel 1
