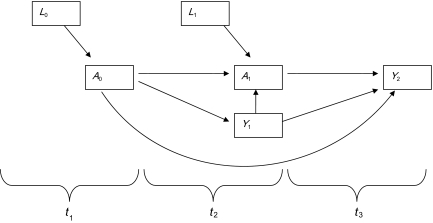
Figure 1.
Causal diagram for the effect of competing social needs on the health status of human immunodeficiency virus-positive, unstably housed women living in San Francisco, California, 2002–2008. A0 and A1 represent measurements of a single exposure variable at 2 consecutive timepoints (t1 and t2). L0 and L1 denote measured confounders that are associated with both A0 and A1 and, therefore, are included in the treatment model. Y1 and Y2 represent the health status at 2 consecutive timepoints (t2 and t3). It is important to note that marginal structural models account for changes in confounding over time and account for the fact that the outcome can influence the exposure.

