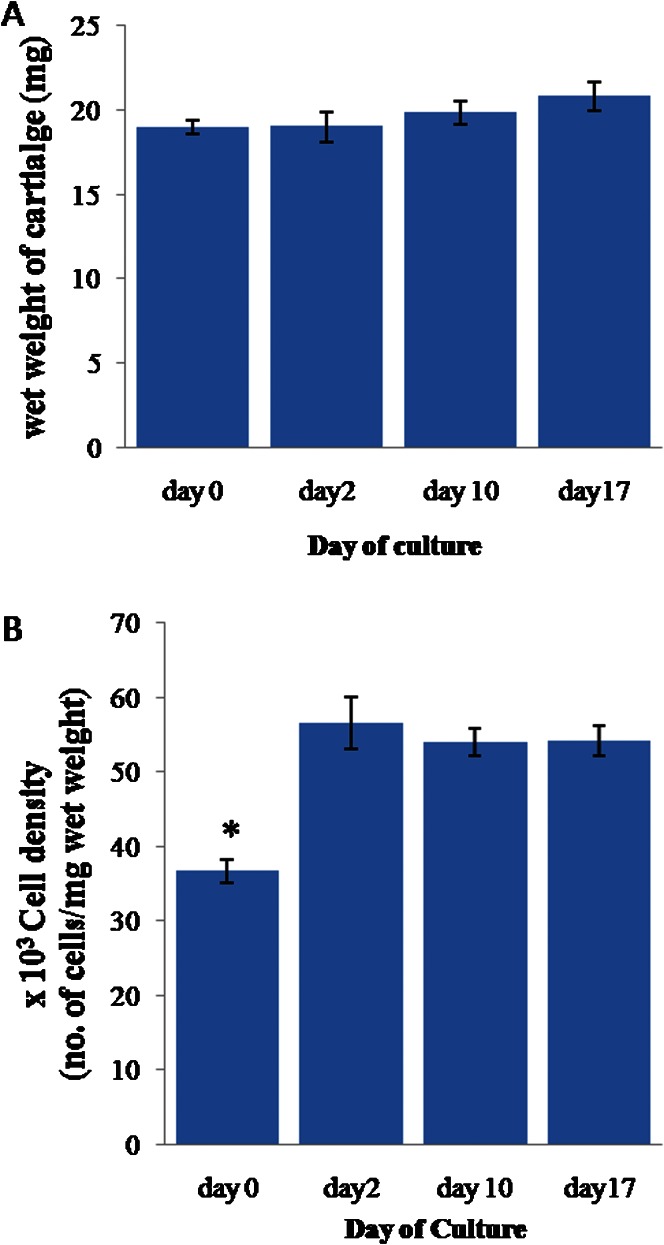
Figure 1.
(A) The wet weight of the full-thickness cartilage. (B) The cell density of the cartilage normalized to the cartilage wet weight. The error bars represent SEMs. n = 22, 12, 51, and 37 for day 0, 2, 10, and 17, respectively. In (B), * indicates p≤0.05 compared to the results for day 2, day 10 and day 17.

