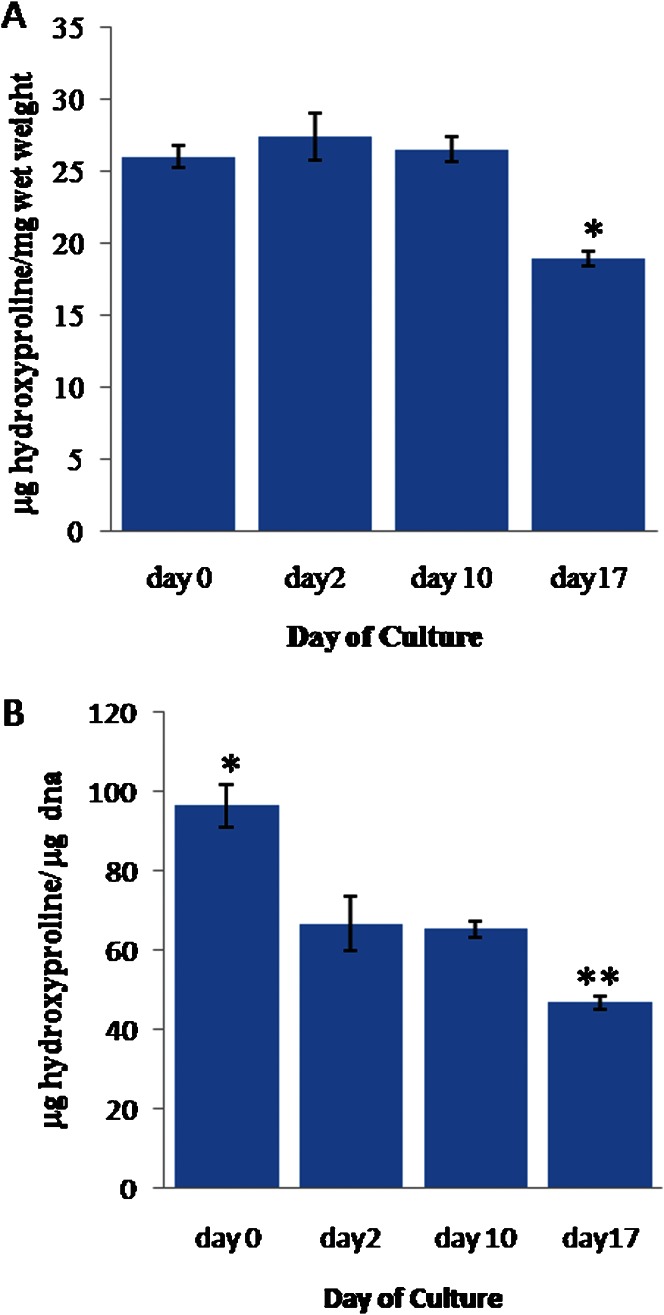
Figure 3.
(A) The weight of hydroxyproline (hyp) in the cartilage explants normalized to the cartilage wet weight. (B) The weight of hyp normalized to the DNA weight. The error bars represent SEMs. n = 22, 12, 51, and 35, respectively. In (A), * indicates p≤0.05 compared to the results for day 0, day 2 and day 10. In (B), * indicates p≤0.05 compared to the results for day 2, day 10 and day 17. ** indicates p≤0.05 compared to the results for day 0, day 2 and day 10.

