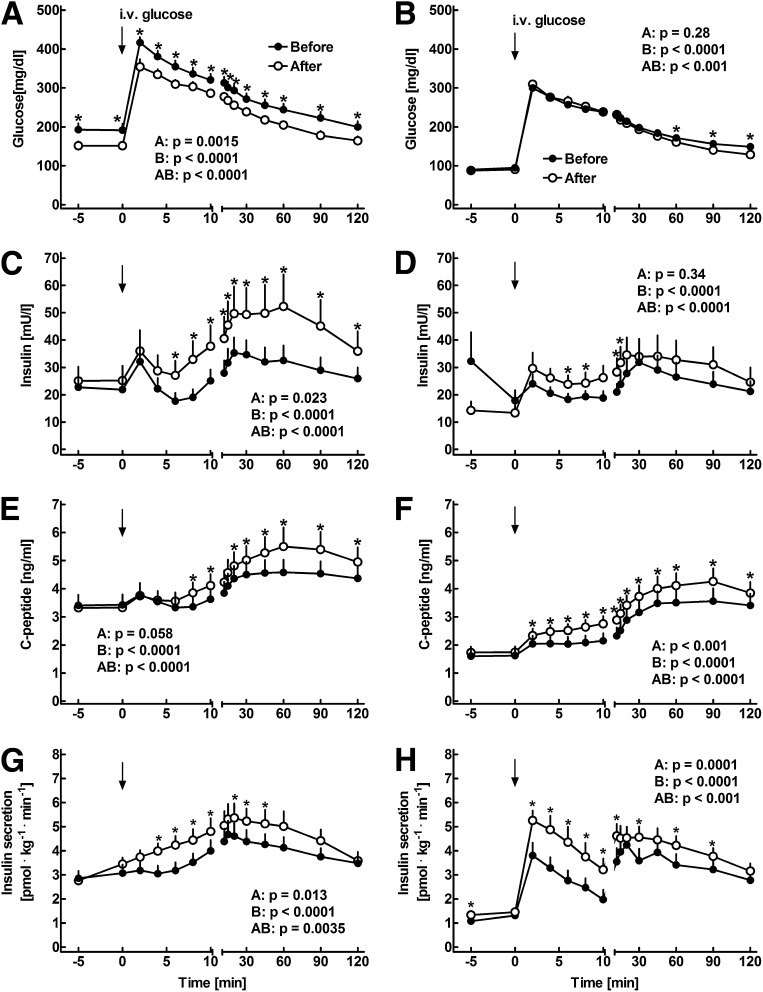
Figure 1.
Plasma concentrations of glucose (A and B), insulin (C and D), and C-peptide (E and F) as well as insulin secretion rates (G and H) in 14 patients with type 2 diabetes before (filled symbols) and after (open symbols) 8 weeks of insulin glargine treatment. Intravenous glucose was administered at 0 min. The experiments were performed without (A, C, E, and G) and with (B, D, F, and H) prior adjustment of fasting glycemia using a 3-h intravenous insulin infusion. Data are presented as means ± SEM. Statistics were carried out using paired repeated-measures ANOVA and denote (A) differences between the experiments, (B) differences over the time course, and (AB) differences due to the interaction of experiment and time. Asterisks indicate significant differences at individual time points (P < 0.05).

