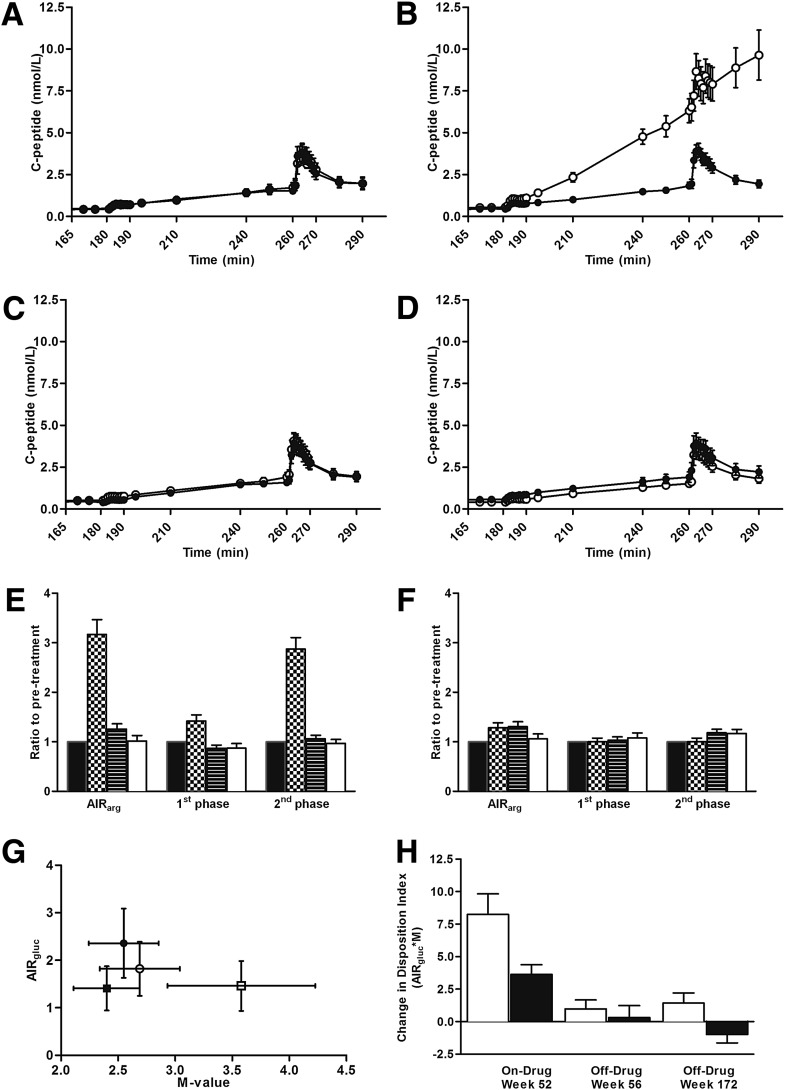
Figure 3.
β-Cell function parameters during 3 years of EXE (n = 16) and GLAR (n = 20) treatment. Serum C-peptide concentrations during hyperglycemic clamp are shown at week 0 (A), week 52 (B), week 56 (C), and week 172 (D). ○ = EXE; ● = GLAR. β-Cell secretory capacity ratio-to-pretreatment is shown in the EXE- (E) and GLAR-treated (F) groups. ■ = week 0 (pretreatment); ▦ = week 52 (on-drug); ▤ = week 56 (off-drug); □ = week 172 (off-drug). Mean DI the EXE- and GLAR-treated group (G). ■ = EXE week 0 (pretreatment); □ = EXE week 172 (off-drug); ● = GLAR week 0 (pretreatment); ○ = GLAR week 172 (off-drug). DI change from pretreatment (H). □ = EXE; ■ = GLAR. Data are mean (SEM) in A–D and G–H; geometric mean (SEM) in E–F. AIRarg, C-peptide response to arginine at 15 mmol/L glucose concentration; AIRgluc and 1st phase, first-phase C-peptide response to glucose; 2nd phase, second-phase C-peptide response to glucose. See Research Design and Methods section for calculations of β-cell function measures.

