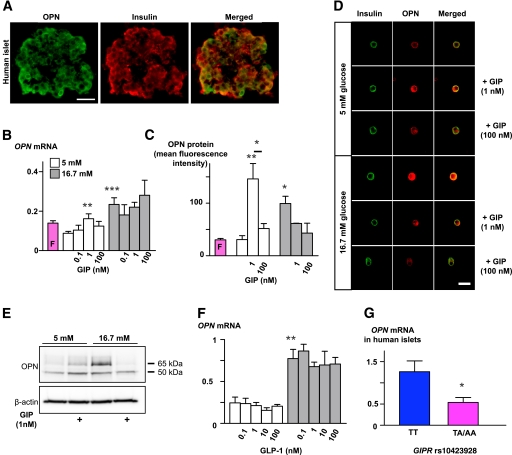
FIG. 4.
Regulation of OPN expression by glucose and GIP in pancreatic islets. A: Immunofluorescence images demonstrating OPN expression (green) in β-cells (red) of human isolated islets. Scale bar = 50 μm. B: Changes in OPN mRNA expression in mouse islets upon incubation in normal glucose (5 mmol/L) or high glucose (16.7 mmol/L) with or without GIP (0.1, 1, or 100 nmol/L) for 24–48 h. **P < 0.01 and ***P < 0.001 vs. 5 mmol/L glucose without GIP. Real-time RT-PCR was performed in triplicate. Experiments were performed 6–16 times, with 100–200 islets in each condition. C: Summarized data from confocal immunofluorescence experiments showing changes in OPN protein expression in β-cells isolated after incubation of mouse islets as described in B. Results show increased OPN expression upon GIP (1 nmol/L) and high glucose stimulation. **P < 0.01 and *P < 0.05 vs. 5 mmol/L glucose without GIP. Experiments were performed three times, once after 48-h incubation and twice after 24 h. Each time, stimulation was performed in duplicate with ∼100 islets per chamber; 28–44 images were analyzed for each condition. D: Representative confocal immunofluorescence images of mouse β-cells double stained for insulin (green) and OPN (red; right panels depict merged images). Cells were dispersed from islets that had been cultured under various stimulation conditions as explained in B and summarized in C. Scale bar = 20 μm. E: Western blot showing increased expression of OPN protein in mouse islets after 48-h stimulation with GIP (1 nmol/L) in normal (5 mmol/L) or high glucose (16.7 mmol/L). GIP had no stimulatory effect under high glucose condition. Two bands were distinguished, one at 65 and the other at 50 kDa. Expression of β-actin was used as loading control. F: OPN mRNA measurement in experiments performed in the same conditions as in B, but with or without GLP-1 instead of GIP, n = 4. **P < 0.01. G: OPN mRNA levels in human islets were lower in nondiabetic carriers of TA/AA (n = 20) than TT genotypes (n = 21). *P < 0.05. (A high-quality digital representation of this figure is available in the online issue.)

