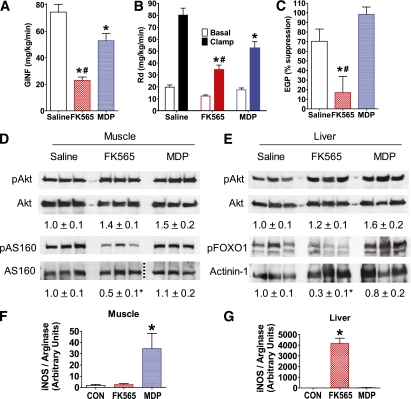
FIG. 3.
NOD1 activation impairs insulin-mediated glucose disposal, suppression of glucose production, and insulin signaling in liver and muscle. A: Glucose infusion rate (GINF) during a hyperinsulinemic-euglycemic clamp in WT mice 6 h after injection of saline, NOD1 ligand (10 μg FK565 i.p.), or NOD2 ligand (100 μg MDP i.p.). B: Peripheral glucose disposal (Rd) during the basal period before insulin infusion (Basal) and during the hyperinsulinemic-euglycemic clamp (Clamp) in WT mice 6 h after injection of a NOD1 or NOD2 ligand. C: Insulin-mediated suppression of EGP during the hyperinsulinemic-euglycemic clamp in WT mice 6 h after injection of a NOD1 or NOD2 ligand. D: Representative immunoblots of postclamp levels of skeletal muscle phospho-Akt (pAkt), total Akt, phospho-AS160 (pAS160), and total AS160, and densitometric quantification (below) of pAkt/Akt and pAS160/AS160. Aliquots of the same samples used to detect pAkt or pAS160 were used to detect Akt or AS160 on parallel gels; the dotted line indicates splicing of the gel to remove unrelated samples. E: Representative immunoblots of postclamp levels of liver pAkt, total Akt, phospho-FOXO1 (pFOXO1), and actinin-1, and densitometric quantification (below) of pAkt/Akt and pFOXO1/actinin-1. Quantitative PCR analysis of iNOS/arginase transcript ratio in (F) muscle and (G) liver 6 h after NOD ligand injection in WT mice. *P < 0.05, compared with saline injection. #P < 0.05, compared with MDP injection. CON, control. Data are means ± SE, n >3 per group. (A high-quality color representation of this figure is available in the online issue.)

