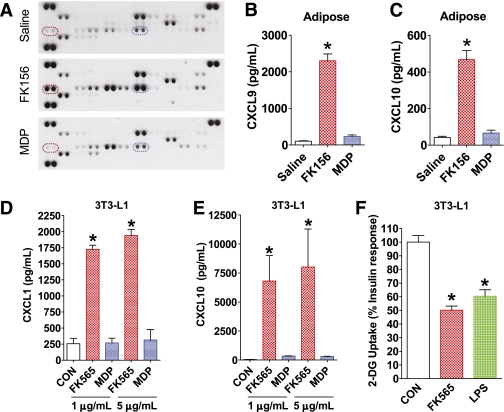
FIG. 5.
NOD protein–induced inflammation in adipose tissue and NOD1-mediated inflammation and insulin resistance directly in adipocytes. A: Simultaneous analysis of 40 cytokines in adipose tissue from WT mice 6 h after injection with saline, a NOD1 ligand (100 μg FK156 i.p.), or a NOD2 ligand (100 μg MDP i.p.). Highlighted by dashed ellipses are duplicate immunoreactive spots for CXCL9 (red) and CXCL10 (blue). Quantification of (B) CXCL9 and (C) CXCL10 in adipose tissue by ELISA, 6 h after injection of WT mice with saline, a NOD1 ligand (100 μg FK156 i.p.), or a NOD2 ligand (100 μg MDP i.p.). Quantification of (D) CXCL1 and (E) CXCL10 secreted from 3T3-L1 adipocytes after exposure to different doses of NOD1 ligand (FK565) or NOD2 ligand (L18-MDP) for 18 h. F: Insulin-mediated glucose uptake in 3T3-L1 adipocytes after direct exposure to a NOD1 ligand (5 μg/mL of FK565) or a high dose of LPS (100 ng/mL) for 3 h. *P < 0.05, compared with saline injection or to vehicle control (CON). Data are means ± SE, n >3 per group. See also Supplementary Fig. 7. A complete map of the cytokines corresponding to immunoreactive spots for the Mouse Cytokine Antibody Array, panel A (catalog no. ARY006) is available from R&D Systems. (A high-quality color representation of this figure is available in the online issue.)

