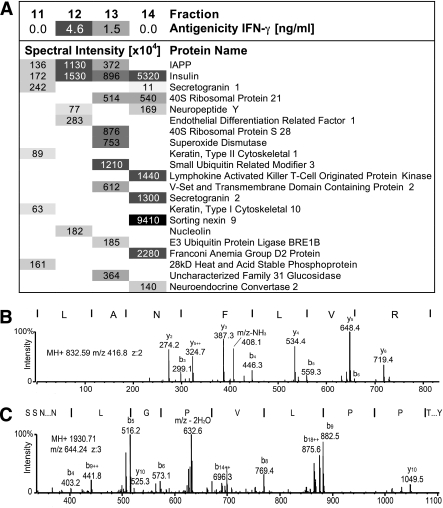
FIG. 2.
Mass-spectrometric analysis of peak antigenic HPLC fractions. Antigenic chromatographic fractions were digested with trypsin, separated by RP-HPLC, and analyzed by ion-trap mass spectrometry; the resulting spectra were used to search a protein sequence database. A: Proteins identified (right column) in the highly purified antigenic RP-HPLC fraction no. 12 and neighboring fractions with lower antigen content (fractions 11, 13, and 14, as shown in Fig. 1B). The summarized spectral intensities (left) are indicative of the relative abundance of a specific protein in a fraction; darker shading indicates higher intensities. B and C: Ion-trap mass spectra matching the IAPP peptides LANFLVR (B) and SSNNLGPVLPPTNVGSNTY (C) (SwissProt accession no. P12968). Data are representative of two separate experiments.

