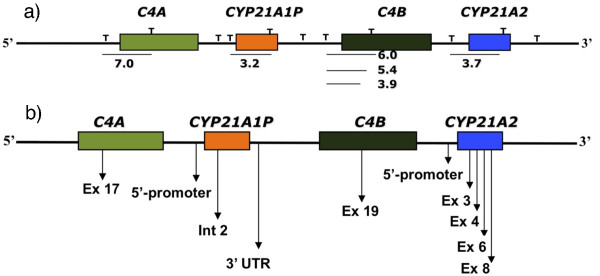
Figure 1.
Schematic representation illustrating the hybridization sites for C4 and CYP21 probes. a) Southern blot: bars indicate hybridization regions for each probe; T denote Taq I restriction sites; numbers indicate sizes in kb of fragments recognized by each probe; b) MLPA experiment: arrows indicate the location where each probe hybridizes. Ex = exon, Int - intron.

