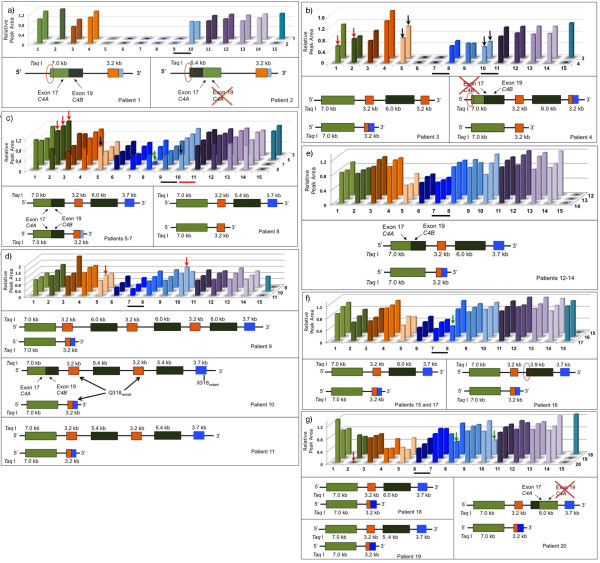
Figure 3.
Integrated and normalized MLPA data. C4A, C4B, CYP21A1P, CYP21A2, TNXB, CREB1 are shown. Numbers 1-15 correspond to: (1) C4A exon 17, (2) C4B exon 19, (3-5) CYP21A1P 5' promoter region, intron 2, 3'UTR; (6-10) CYP21A2 5' promoter region, exon 3, exon 4, exon 6, exon 8; (11-13) TNXB exon 32, 15, 1; (14) CREB1 probe. (15) Y-chromosome probe. Horizontal black bars denote recombination breakpoints (RB); red bar, for patient 8. Columns correspond to integrated and normalized electropherogram peak areas, values between 0.8 and 1.2 indicate two copies, below and above correspond to one or more than two copies, respectively. Patients' numbers are on the right. Green arrows indicate heterozygosis for p.I172N and p.Q318X (patient 18). Black arrows indicate 2:1 ratio for two copies of 3'UTR pseudogene (5) and one copy of exon 8 (10). (a-g) Upper panels - MLPA results; lower panels - schematic genotypes. a) Monomodular homozygosis; red circles denote different C4 5'-end; b) Mono- and bimodular alleles carrying chimeric genes; red arrows indicate 1:2 ratio (C4A:C4B); c) heterozygosis for mono- and bimodular alleles; red arrows indicate three copies of C4B; d) heterozygosis for mono- and tri- or tetramodular alleles; red arrows indicate 2:2 ratio for 3'-end CYP21A1P (5) to exon 8 CYP21A2 (10); patient 10 - trimodular allele bearing normal p.Q318 in the two pseudogenes; e) heterozygosis for alleles mono- and bimodular with CYP21A1P/A2 and C4A/C4B, respectively; f-g) heterozygosis for mono- and bimodular alleles; RB between exons 3-4 and 1-3, respectively; red arrow - null C4B hybridization signal (patient 20).

