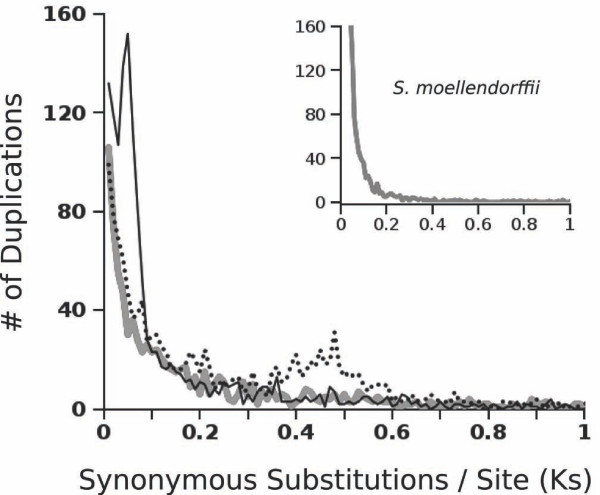
Figure 1.
Simulated Ks Distributions of Duplicated Genes. Frequency distributions of synonymous site divergence (Ks) at nodes of gene family trees for loci in a sample of the S. moellendorffii genome (inset), a simulated genome based on those same loci (grey line), and a whole genome duplication of the simulated genes that has since evolved for 0.05 Ks (solid line) and 0.45 Ks (dashed line).

