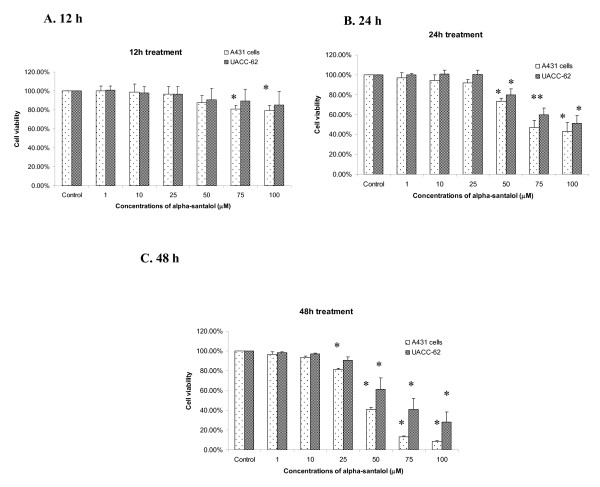
Figure 1.
Effects of α-santalol on cell viability in A431 and UACC-62. Cells were treated with α-santalol (0-100 μM) for 12 h (A), 24 h (B) and 48 h (C). At the end of the respective treatments, MTT assay was performed as detailed in the materials and methods. Values are mean ± SD of three independent observations. *, P < 0.05 indicates significantly lower after α-sanatalol treatment as compared to their individual control cells.

