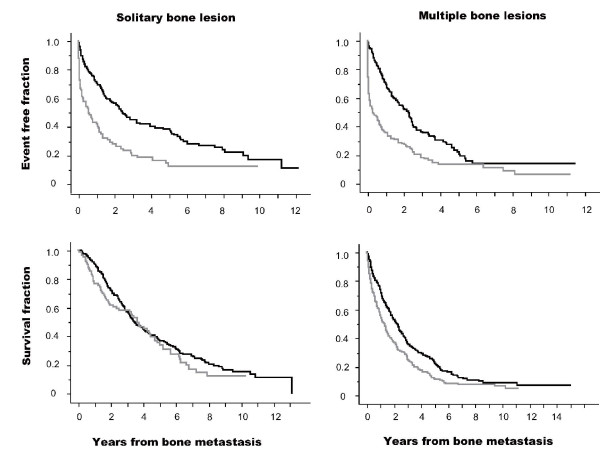
Figure 5.
Kaplan-Meier curves of SRE and CSD in patients with (gray line) and without pain (black line). Upper row figures indicate the analysis using SRE as an event. Lower row figures indicate the analysis using CSD as an event. Left line figures indicate the analysis in patients with a solitary bone lesion at the date of skeletal metastasis diagnosis, and right line figures indicate patients with multiple bone lesions. Starting point was the date of diagnosis of skeletal metastasis. Black lines indicate patients without pain and gray lines indicate patients with pain. A log-rank test in each patient group with solitary bone lesion and SRE event, solitary bone lesion and CSD event, multiple bone lesions and SRE event, and multiple bone lesions and CSD event were performed with χ2 values 27.4 (p < 0.0001), 0.8 (p = 0.36), 48.8 (p < 0.0001), and 15.8 (p < 0.0001), respectively.

