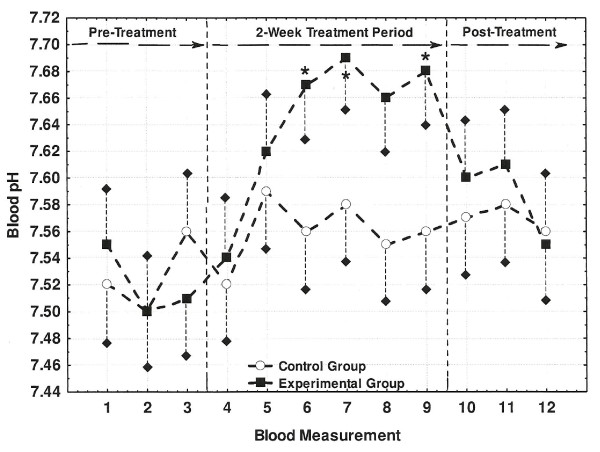
Figure 3.
Changes in fingertip blood pH across the three study periods. Blood pH values correspond each of twelve (i.e., M1-M12) fingertip collections. Values marked with an asterisk (*) differed significantly from the M1 reference values of 7.53 and 7.52 for the Control and Experimental groups, respectively (P < 0.05). Short dashed lines represent one-side SE bars.

