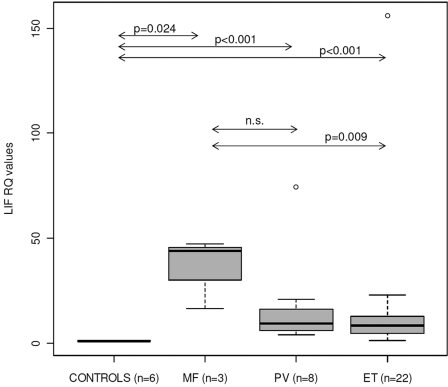
Figure 2.
LIF expression is significantly increased in MPN patients. Relative quantification by real-time RT-PCR in peripheral blood samples from 6 healthy controls and 33 MPN patients (3 myelofibrosis, 8 polycytemia vera, and 22 essential thrombocytemia). Boxplots show the median (horizontal line), interquartile range (box), and range (whiskers). All results were normalized to the average of the 6 control samples. Significance of the Mann-Whitney test is shown for several comparisons.

